|
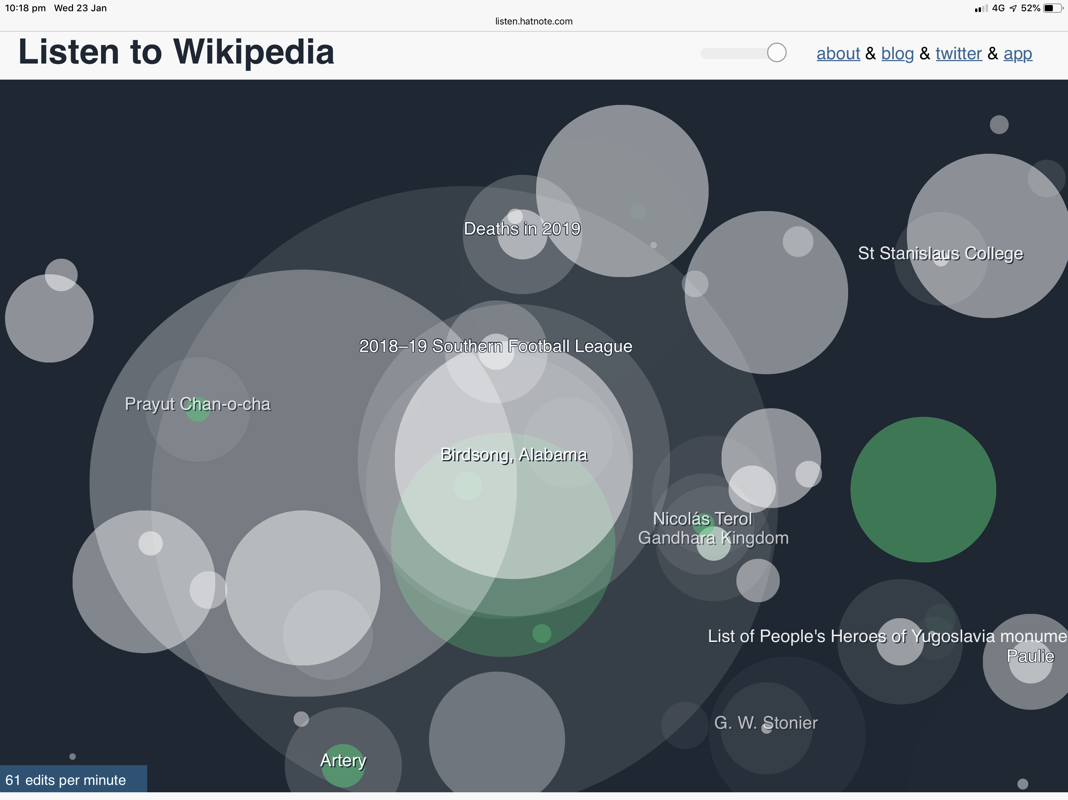
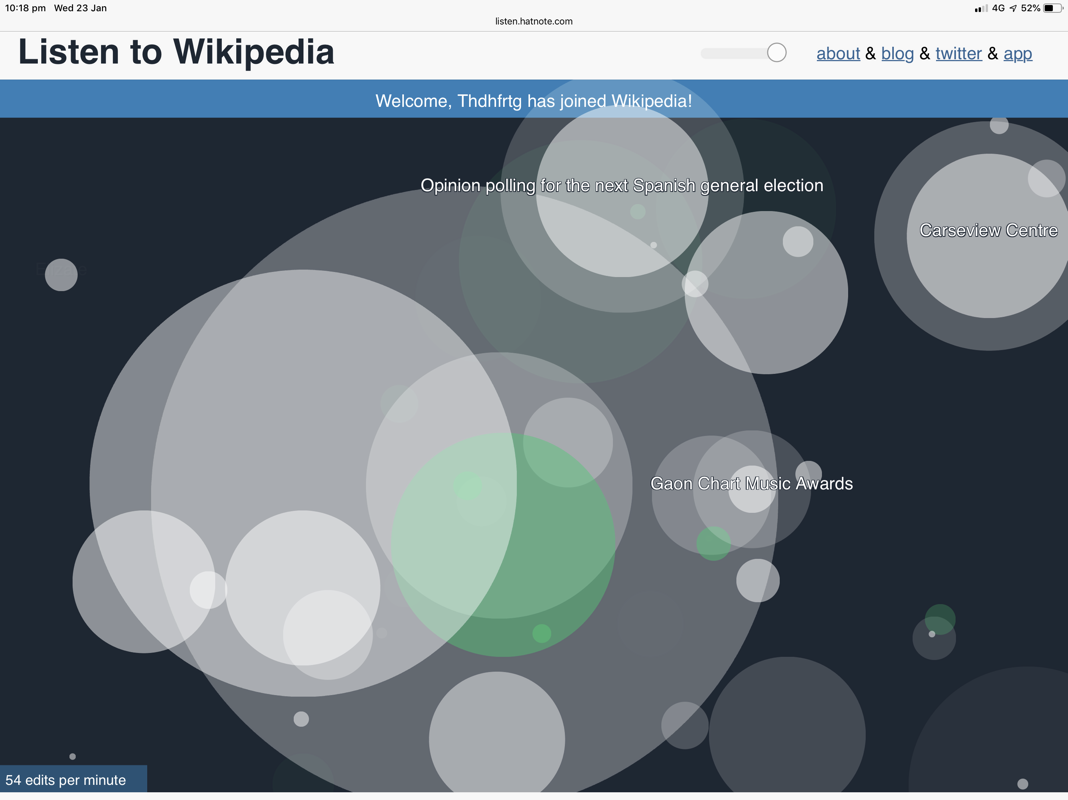
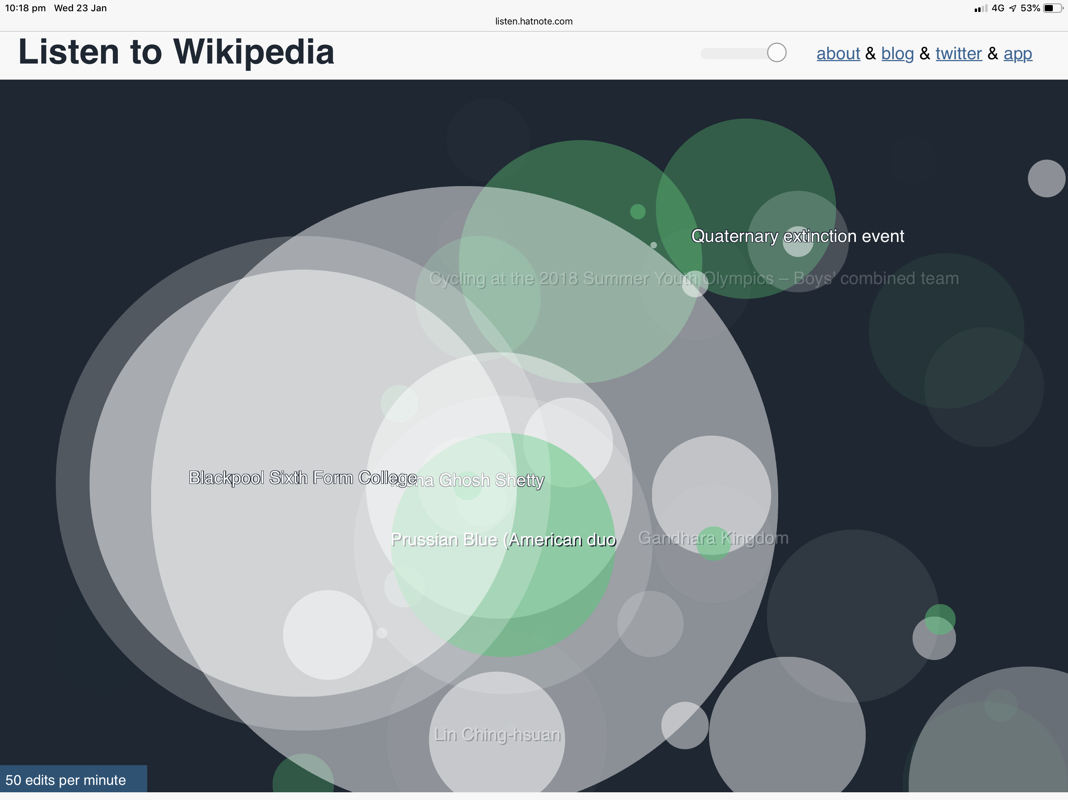
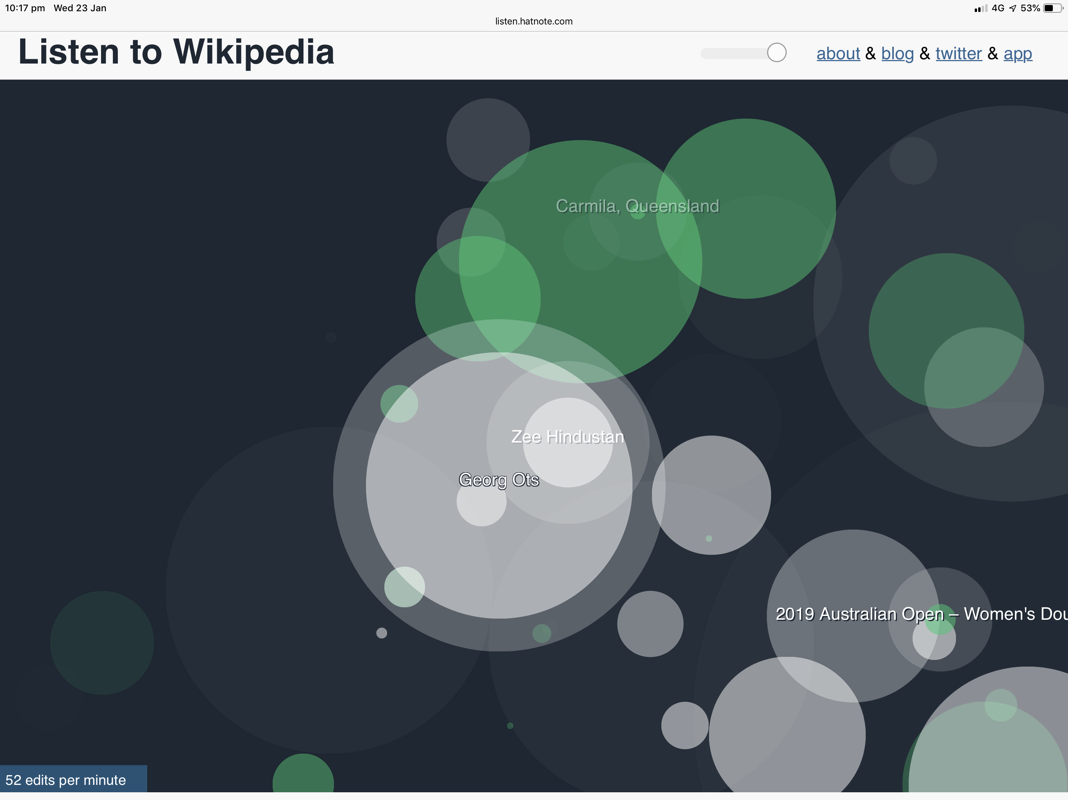
Today, I have had my mind mind officially blown away by the coolest piece of data visualisation! I know, I’m probably slow to the scene, but you should immediately go and check out: http://listen.hatnote.com No seriously. Right now... Okay, maybe after I have finished raving. The website is Listen to Wikipedia, and it’s purpose is to create audio that represents the creation and removal of data on Wikipedia. The sound and strength of the notes depends on the size of the edit and who made it. The sound is absolutely lovely, and somewhat meditative. While the music plays, the titles of the pages being edit pop up on the screen like soft bubbles. What an engaging and lovely way to display this data! I can’t help but wonder what this would sound like connected to Trove. Or if it could be the sound in an entrance to a museum, being triggered off by people using the website or the data. This style of visualisation could provide a beauty that connects people to the importance of research and information creation. A bit of research tells me that this isn’t the first amazing visualisation project that has been created the designer Mahmoud Hashemi. Working with Hatnote and Wikipedia, the designer has been a part of a number of heritage based visualisation projects, that are just very cool. I hope this brings a little joy into your life this week. http://sedimental.org/hatnote_projects.html
0 Comments
Leave a Reply. |
Museum working, game playing and dog loving geek. Tune in for musings about the GLAM sector, and generally geekiness.
Archives
April 2020
Categories
All
|
 RSS Feed
